
Key Insights
Data sources
Any successful strategy is founded on good information. The key insights below are grounded in a thorough data collection and analysis, which evaluated quantitative and qualitative data points assembled during March and April of 2022.
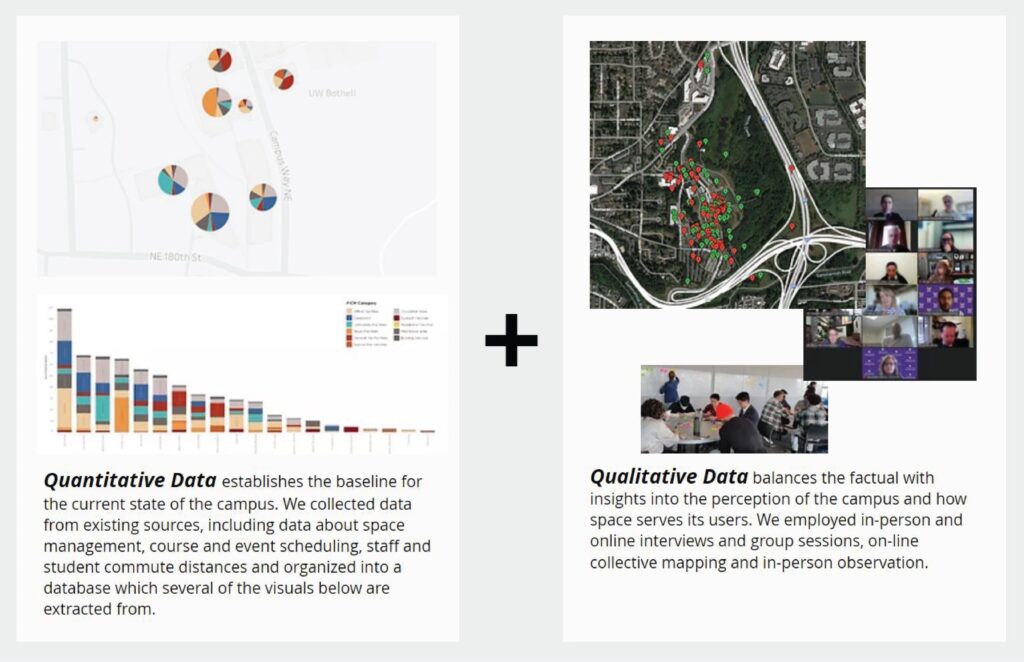
Considered in isolation from one another, quantitative and qualitative data may fall short. Evaluated in conjunction with one another they offer insights that otherwise may not be readily apparent. When assessing the data, we evaluated where qualitative and quantitative findings aligned, and where they didn’t support one another. Following is a selection of key insights about the campus spaces that lay at the foundation to a series of opportunities as the campus considers how its space may be optimized.
Context among peers
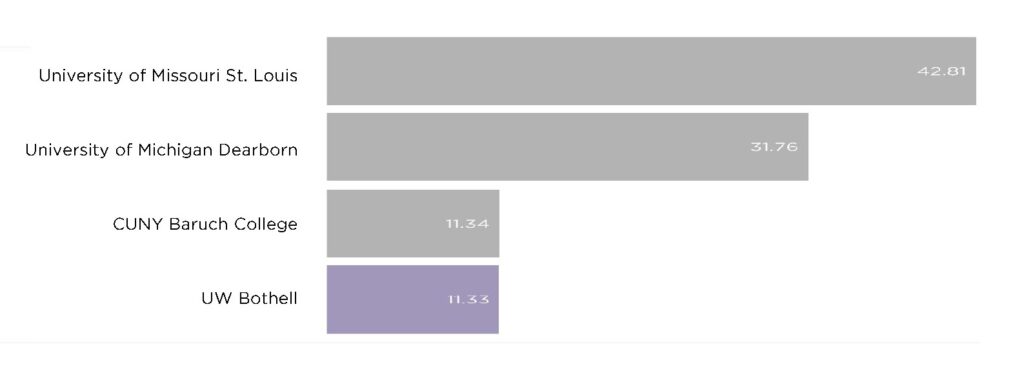
Key Insight: Compared to peers, UW Bothell is space constrained.
What the quantitative data shows:
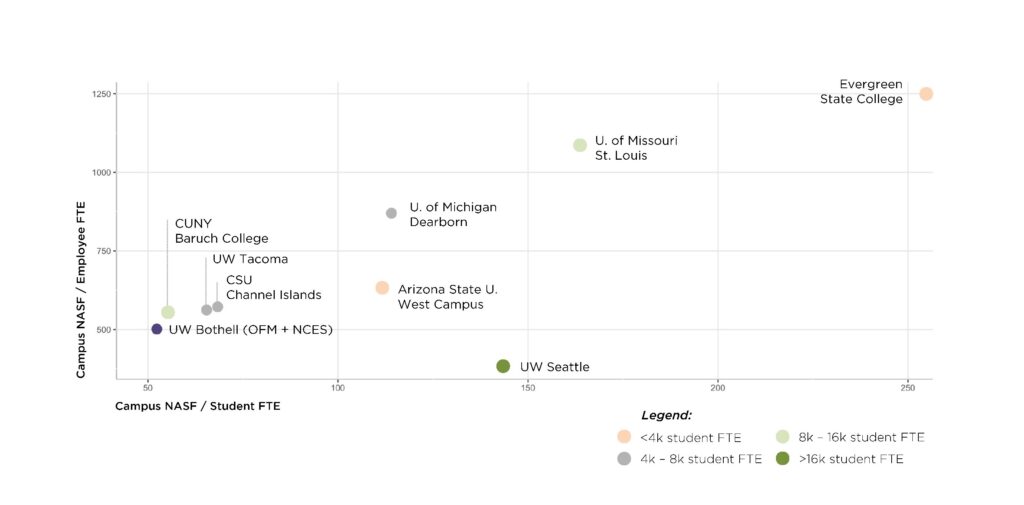
Excludes residential and parking garages.
A comparison of common space allocation indices between the University of Washington Bothell and its peers reveals that campus net assignable square feet (NASF) per student and per employee are both low. But not the lowest when it comes to NASF per employee FTE.
What we heard:
- There is a general perception that the campus is short on space. This perception is supported by the peer comparison, with nuance that distinguishes between space per student vs. employee.
Office space allocation
Key Insight: Office space is the largest space user on campus. But office allocation does not reflect frequency of use.
What the quantitative data shows:
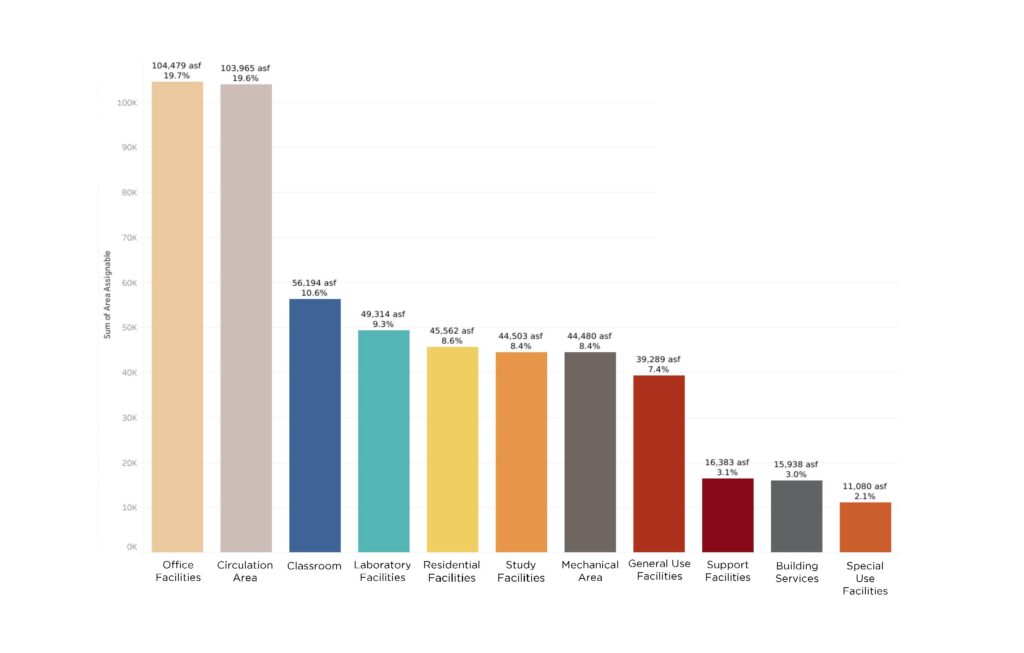
Excludes parking garages
What we heard:
- Teaching faculty must share office space, even though they see the largest number of students.
- Some staff must use open office space while private offices lie vacant.
- Many of the staff interviewed anticipate working remotely at least two days a week.
Space and Identity
Key Insight: Each building contains multiple use types. This makes the relatively small campus hard to navigate and the integrated services more difficult.
What the quantitative data shows:
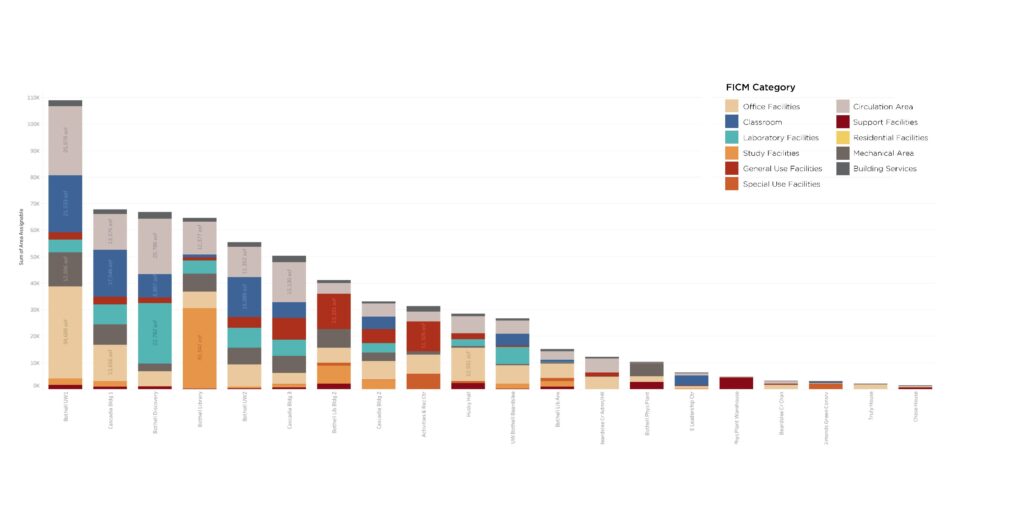
Excludes residential village
What we heard:
- Students identified a lack of intentionality about the campus buildings, and a confusing experience getting oriented on campus.
- Some staff voiced the desire to be housed closer to one another in order to better deliver integrated services to their students.
Instructional space
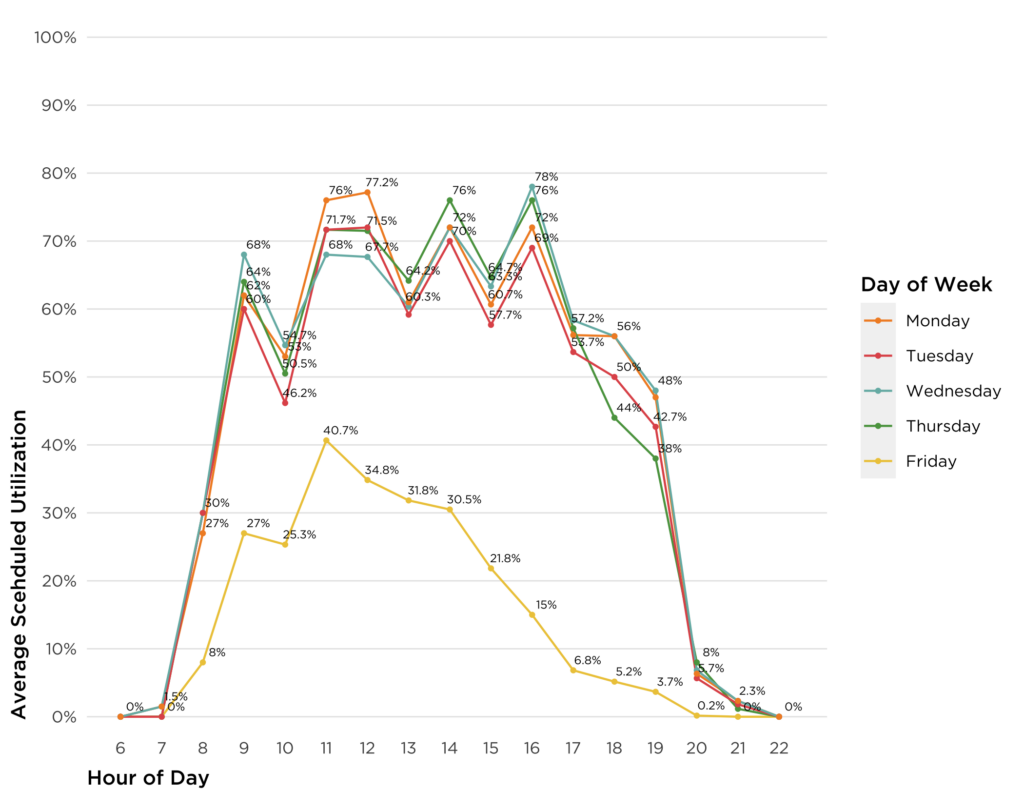
Key Insight: Classrooms are heavily scheduled, labs less so. To meet the need for an increase in hybrid and online class-taking space, the university should broadly consider instructional definitions and spaces.
What the quantitative data shows:
What we heard:
- Some staff noted that class scheduling causes peaks and valleys of campus activity, leading to traffic congestion at specific times.
- Interviews revealed that outdated classroom technology represents a burden for faculty and limits access to asynchronous learning.
- Not all lab preparation space is considered adequate by some faculty, causing inefficiency in space use.
Community
Key Insight: Community is at the heart of the University, and an enriched campus community experience is priority. But community space is constrained, and perceived barriers exist.
What the quantitative data shows:
On-campus general use space is limited. Compared to peer institutions, general and special use space per student is low. General use refers to meeting rooms, informal collaboration areas, and event space among others.
What we heard:
- Students , faculty and staff identified “community” as the predominant word to capture the essence of UWB.
- ARC falls short as a community magnet due to its status as a student only, reservable space that is not reliably available for informal “hang-out” time.
- Faculty voiced having no reason to stay on campus. Spaces for informal interaction and serendipitous encounters are limited.