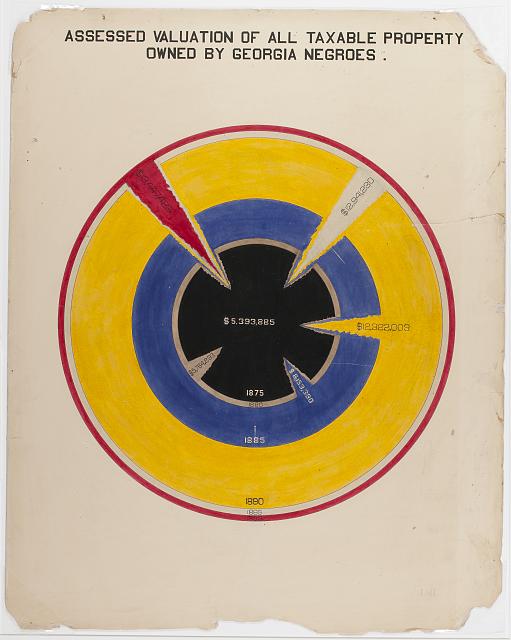
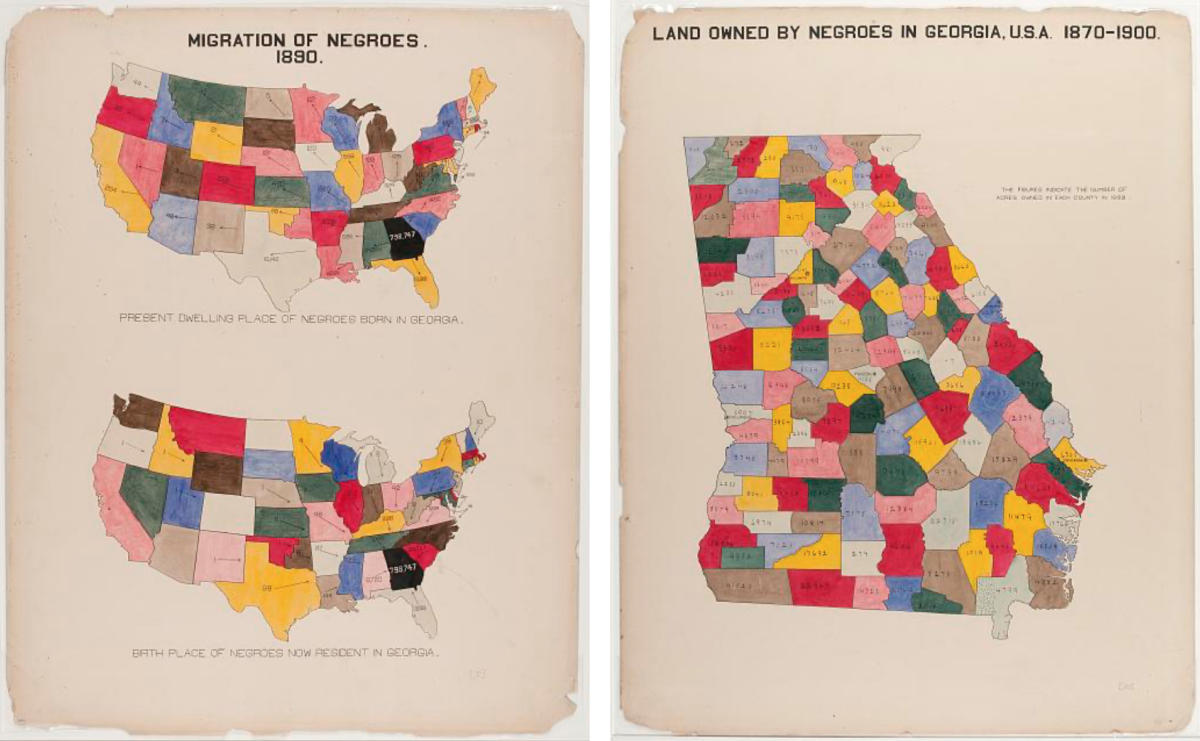
Dr. Robin Angotti first saw data visualizations from W.E.B. Du Bois’ exhibit at the 1900 World’s Fair in Paris during a webinar in February 2023. The visualizations focused on the resilience of Black Americans in the decades following emancipation. They provided important historical data in a new visual context, and she couldn’t believe it was the first time she had seen them.
A math professor in the University of Washington Bothell’s School of STEM, Angotti had previously taught courses on data visualization. She often talked about the historic figure Florence Nightingale and other luminaries, but somehow she had never heard of Du Bois’ groundbreaking work in this area. She wasn’t the only one.
“Everybody knows him as a sociologist, but few people understand and know about his data visualizations. That part of his work, I think, has really been whitewashed from history,” Angotti said. “So seeing them for the first time — how profound they were and how much they moved me — I thought it would make for a great class.”
When the University of Washington Honors Program reached out to see if she was interested in teaching a course, Angotti knew it was the perfect opportunity to bring awareness to Du Bois’ work.
Recreating the work of a visionary
The webinar Angotti attended last year featured guest speakers from The Duboisians, an organization that brings Du Bois data visualization work into the classroom. Each year, the organization hosts an online challenge to celebrate Du Bois’ work by using modern tools to recreate the visualizations from his 1900 Paris exhibition.

In her autumn 2023 Honors course, Angotti thought recreating the visualizations seemed like a good place to start. But before throwing the data in a modern program, she asked her students to first recreate the visualizations by hand.
Angotti said this exercise required students to approach the visualizations more deliberately. They were able to experience the level of intention Du Bois brought to each element, knowing that the work couldn’t be easily changed after it was put on the page — unlike visualizations done using modern technology.
“I wanted to make them think about why they wanted to visualize something and why they wanted to put certain things together, and what colors they wanted to use and the profound impact that color was going to have,” Angotti said.
Color, she added, played a significant role in Du Bois’ work, as his color scheme often reflected the green, yellow and red of the Pan-African flag.
“Data is about being a storyteller, and the story Du Bois told was one of Black resilience,” she said.
Telling a story of resilience
African Americans faced many hardships in the post-emancipation era, Angotti said, and Du Bois’ work was unique because it centered on the progress being made.
“Du Bois’ focus wasn’t to talk about the plight of the Black American. It was about their resilience and how far they’d come since emancipation,” she said. “It was a really positive spin on what was happening in the country at the time, which was right in the middle of Jim Crow laws and lynchings and all kinds of terrible things. It was very powerful.”
One of the most challenging parts of teaching her new course, Angotti said, was having to step out of her comfort zone as a math professor to broach difficult conversations about race and the historic context of Du Bois’ work. “As a mathematician, it was so out of my wheelhouse,” she said. “It was terrifying but also life-changing for me. I didn’t want to mess it up. I wanted to do it right and give it the justice and intention it deserves — and that Du Bois deserves.
“If we aren’t willing to take risks, make mistakes and have hard conversations,” she added, “nothing will ever change.”
Throughout the course, Angotti shared her fears about getting it wrong with her students. For first-year student Ashley Olson, it was refreshing to hear a professor be so vulnerable.
“The transparency between the student and the educator was great because we were learning at the same time,” said Olson, who is double majoring in Psychology and in Educational Studies. “Professor Angotti is clearly extremely knowledgeable, but this was a new class for her, so it made things more comfortable to know we were all thinking about it together.”
If we aren’t willing to take risks, make mistakes and have hard conversations, nothing will ever change.
Dr. Robin Angotti, professor, School of STEM
Visualizing modern data
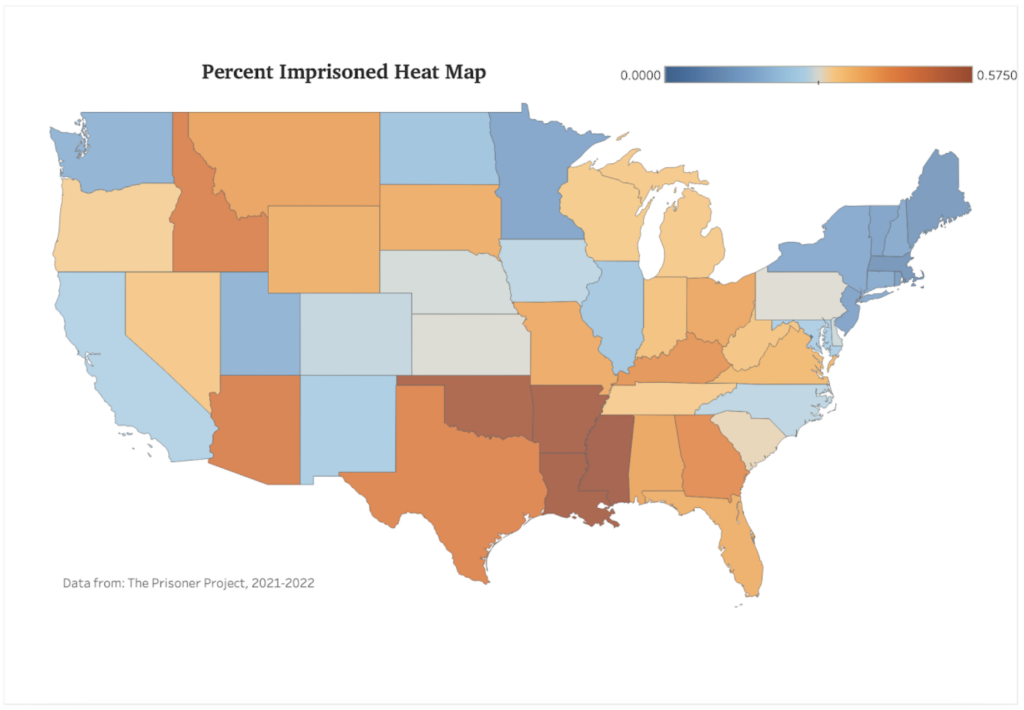
After recreating Du Bois’ work by hand and then in the data visualization software Tableau, students used modern data to look at some of the current issues affecting Black Americans today, from education gaps to the prison pipeline.
“Studying Du Bois’ data visualizations from the 1900 Paris Exposition helped me understand the power of data to impact positive social change and the importance of its presentation,” said Adam Friesz, a sophomore majoring both in Electrical Engineering and in Computer Engineering. “This context helped me concentrate on the humanity that data represents and its power to tell a personal story.”
For his project on what he learned about the modern context, Friesz created a visualization comparing imprisonment and domestic immigration rates to map the journey of formerly incarcerated people.
Angotti taught students looking at modern examples how to analyze and interpret data and to recognize when something doesn’t look right or is trying to weave a false narrative. This is a skill that’s particularly important in a presidential election year, she noted.
“Since taking this class, I have become more aware of data visualizations in the world around me and how different techniques are used to impact my perception,” Friesz said. “I appreciated the course’s joint focus on the thought-process behind designing data visualizations and the software skills used to create them.”

Taking risks to create change
Although many of her students were STEM majors, Angotti said everyone can learn from Du Bois’ work and the study of data visualization.
“No matter what area of study you’re going into, making sense of data is an important part of being an educated citizen today,” she said. “Everyone should be data literate.”
While it was a risk to get out of her comfort zone and teach something new, Angotti said it was a risk well worth taking. She hopes to continue teaching this course in the future and to look for ways to bring its themes into her other classes.
“Teaching this class was one of the most rewarding things I have ever done in my career,” Angotti said. “As an interdisciplinary course that combined history, math, sociology, science and research — all these things that come together — it changed my thoughts about how we should teach data visualization.”


